Code quality metrics based on 2025 breakthrough AI research
GitClear's latest research, AI-Generated Code Exerts Downward Pressures on Code Quality has been cited by more than 10 media outlets, YouTube influencers, and Developer Experience authors, including:
Now, GitClear is offering the stats used by our research FREE to new customers.
Google DORA Metrics: Free for GitClear users
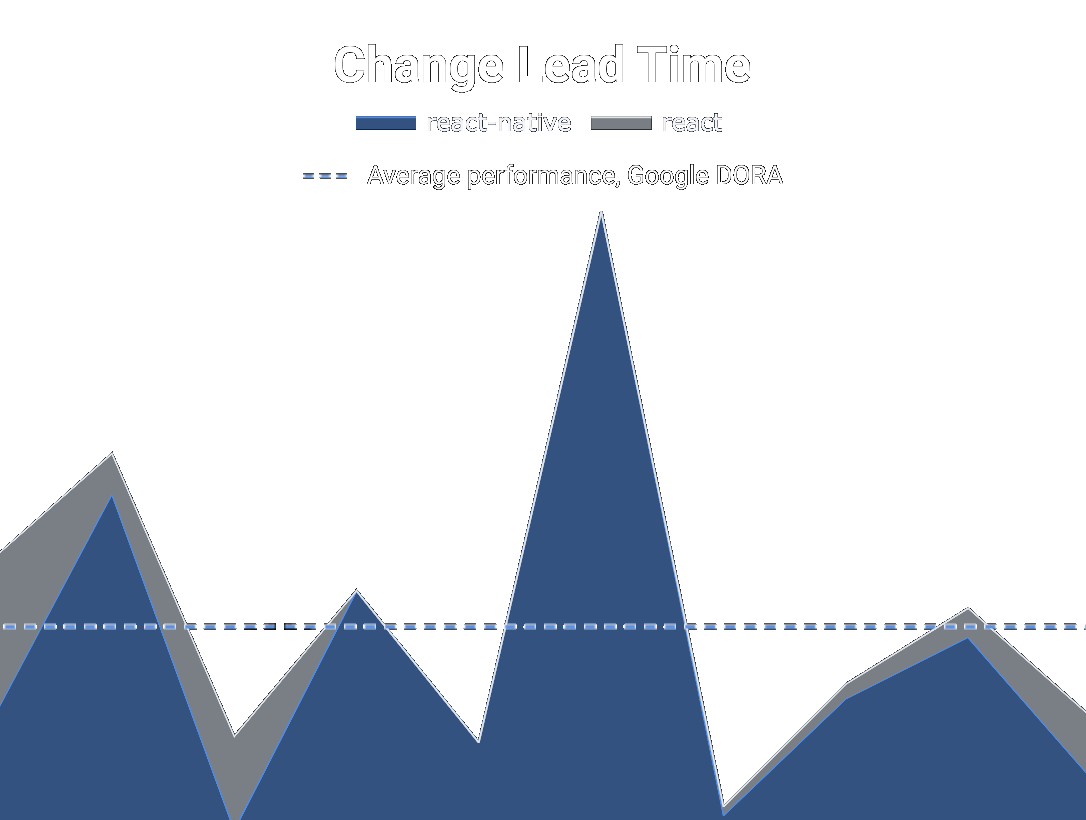
The four DORA metrics (deploy frequency, change lead time, failed deployment recovery time, change failure rate) are just the start of what GitClear customers receive with a free subscription. Compare your team to the 2023 baseline values published by Google, and go beyond DORA with deep insights into how code quality is changing.
No credit card required. Sign up and try it yourself.
🌞 Developer-Friendly Metrics
GitClear has set the industry standard in allowing Developers to control how their data is accessed. We offer as many tools and reports for Developers as we do for their Managers. GitClear data promotes 2-way sharing between Developers and Managers.
🕵️♂️ Sniff out tech debt in existing code
Not only can GitClear pinpoint when duplicated and high-churn code is happening, our "tightly coupled change" and "bug-prone file" detection help the team sift out the most problematic directories and files.
Pull request stats, velocity stats, DORA stats, code quality stats -- one GitClear account unlocks them all, across more than 40 programming languages supported.
Reports offered in the basic free plan
- Release frequency
- Change lead time
- Time to fix critical defects
- Change failure rate
- Diff Delta velocity
- Copy/Paste (duplicated) code percent
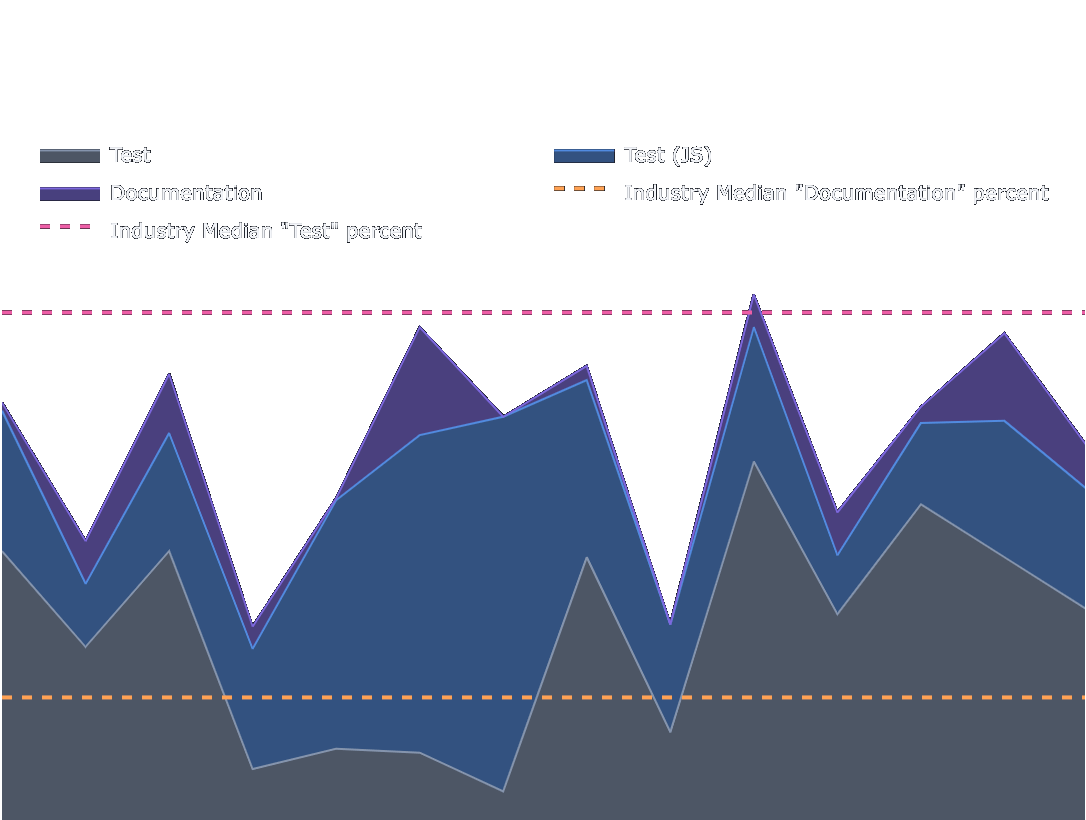
- Test and Documentation code percent
- And many, many more....
"Industry Median" benchmark line is available with most reports for Pro+ subscribers.
How does it work?
-
Connect to your git provider (GitHub, GitLab, Bitbucket, Azure Devops supported)You control what repos are processed. Automatic repo sync available.
- Connect to Jira or GitHub Issues to correlate issues and code (optional)
- Receive free reports on DORA and Code Quality
📏 GitClear helps teams make measured decisions
Get More with
GitClear isn't just a tool for code quality and Google DORA measurement. We also offer dynamically updating images that can be used to glimpse your team's progress from your own dashboards, README files, and more.
For Developers, GitClear offers a unique pull request tool that recognizes more granular changes than other PR tools, saving review time. It can also summarize file- and PR-wide changes using AI. Our Developers' favorite chart is the Commit Activity Browser which summarizes recent progress across the team, taking the place of a daily stand-up meeting for many teams.
Commit Activity - Real-time glimpse at what the GitClear CEO has programmed lately
As seen in a GitHub profile
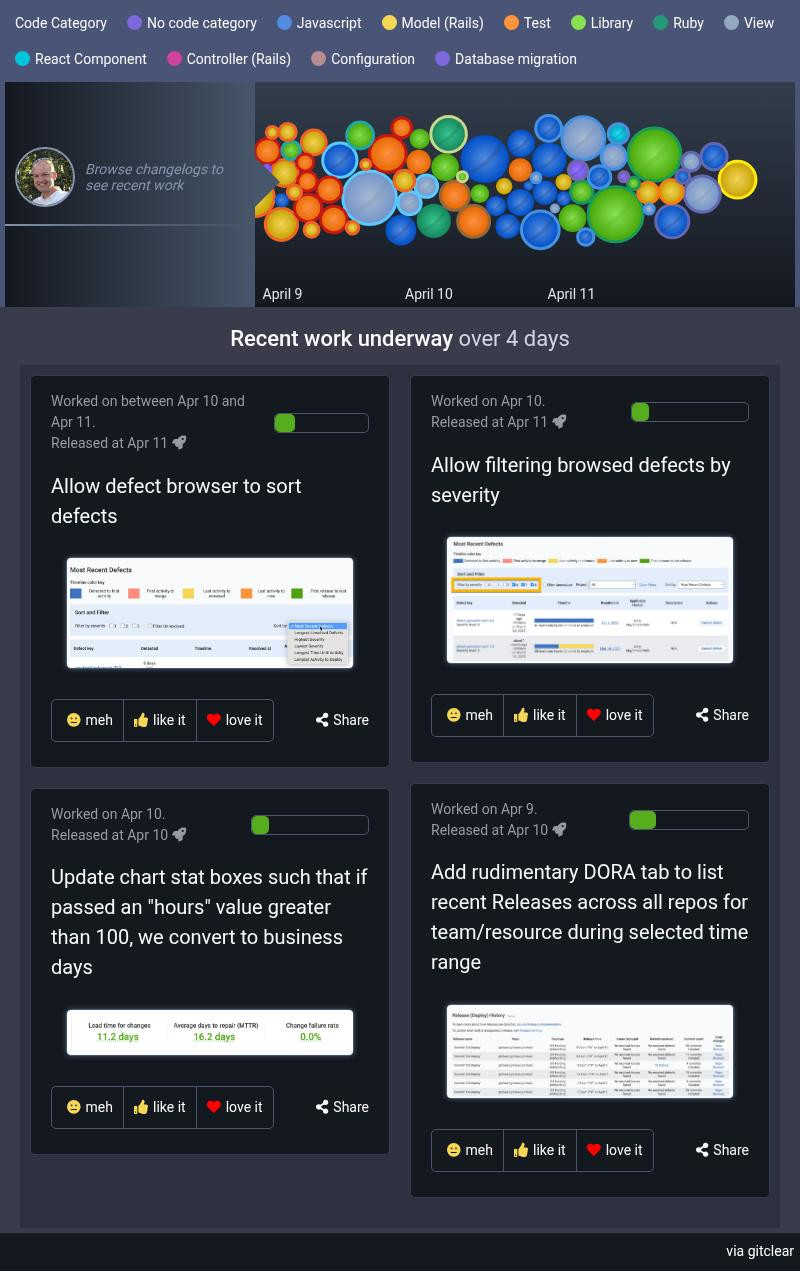
Commit Activity Bubbles
Shows recent work, with commits sized to approximated how much energy that went into completing each commit. The set of commits can be color-coded by either
- Issue/Jira ticket being worked
- Repo
- Branch
- Code Category (shown in example)
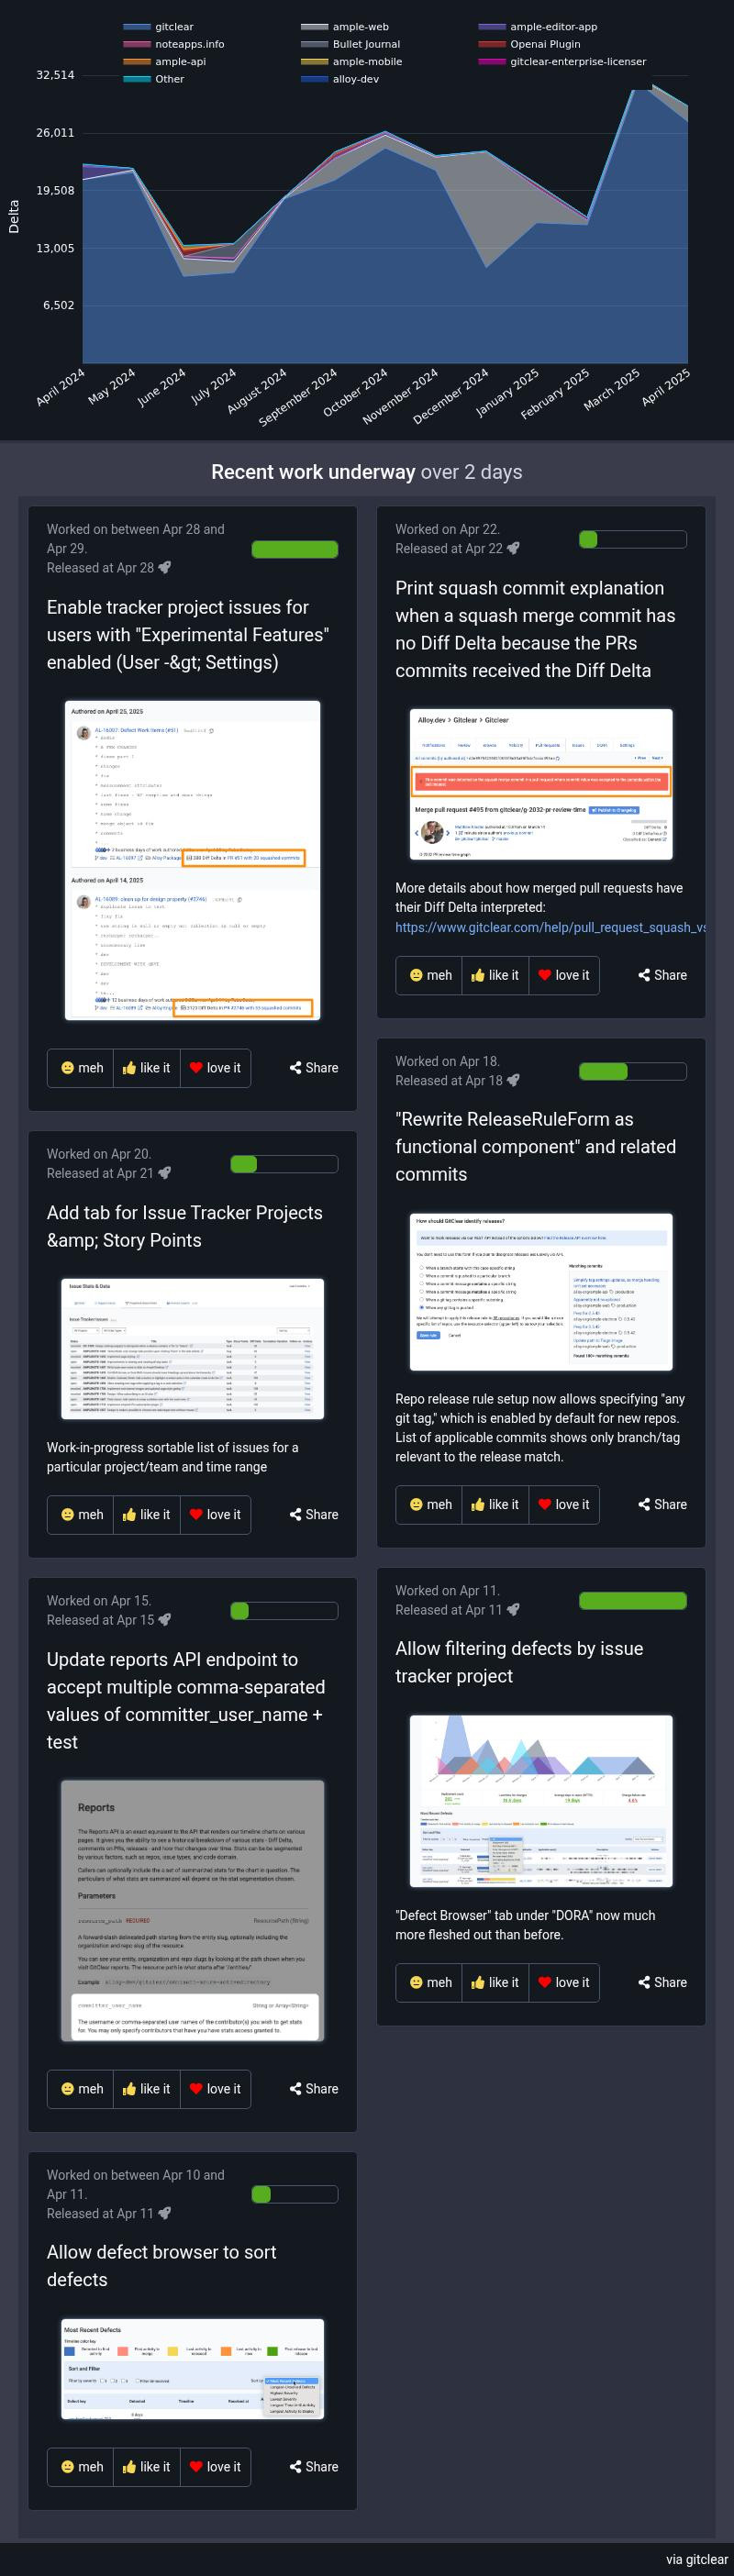
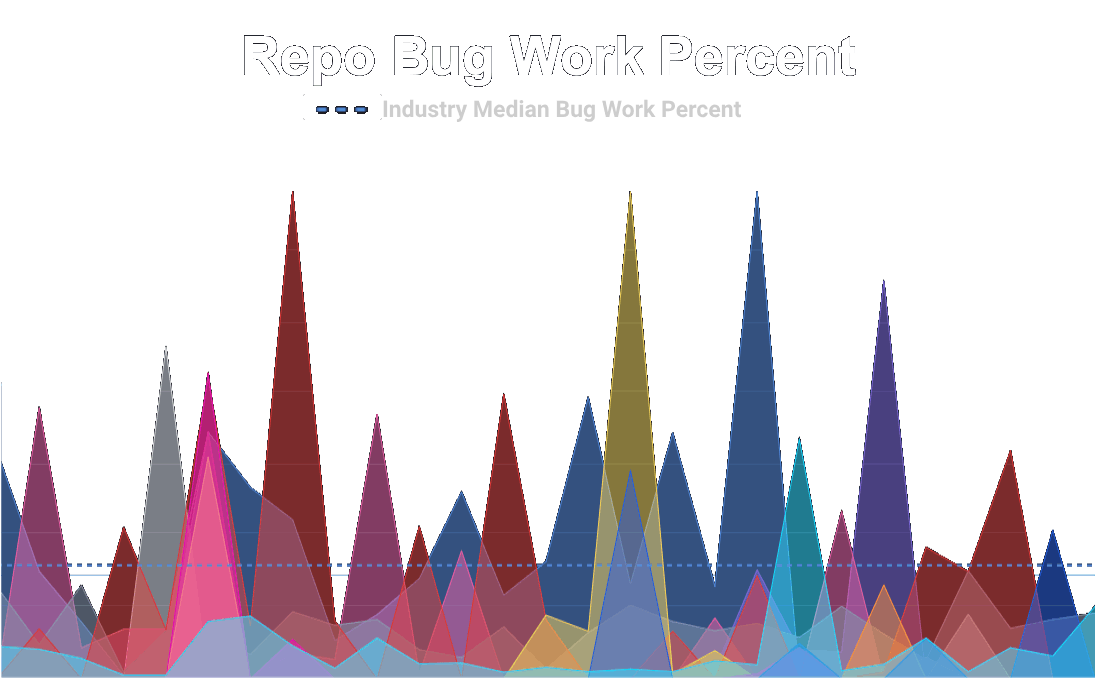
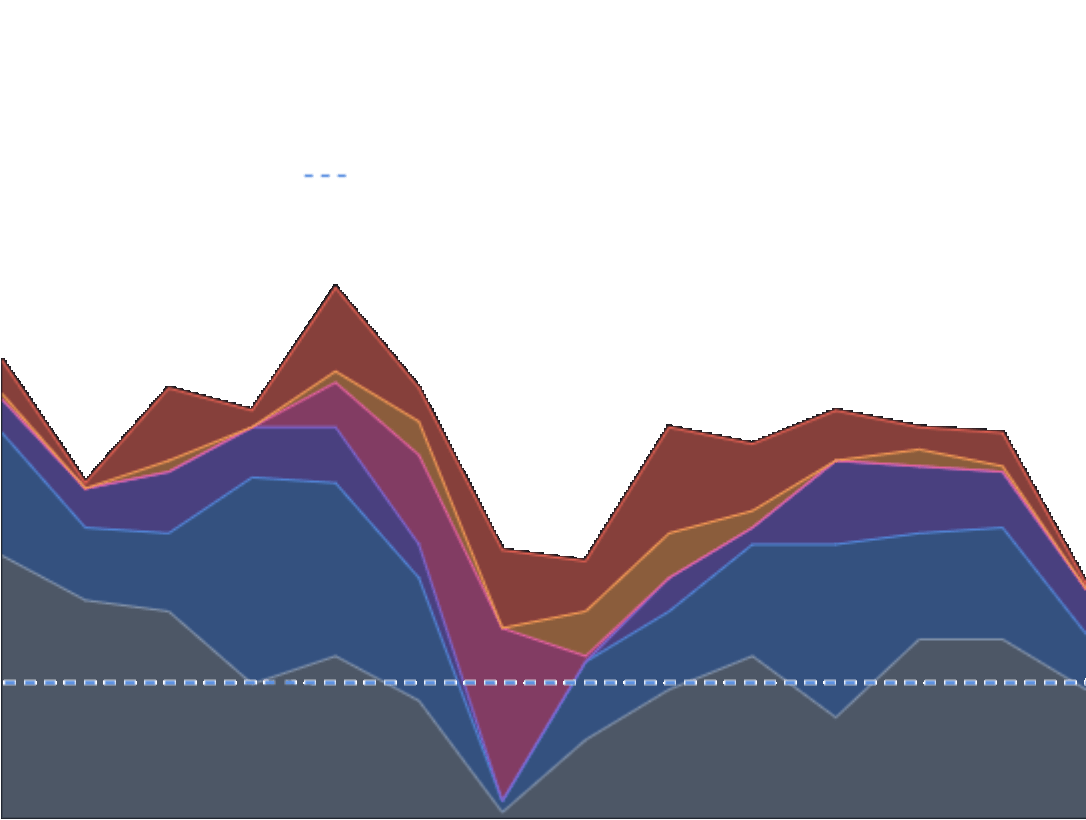
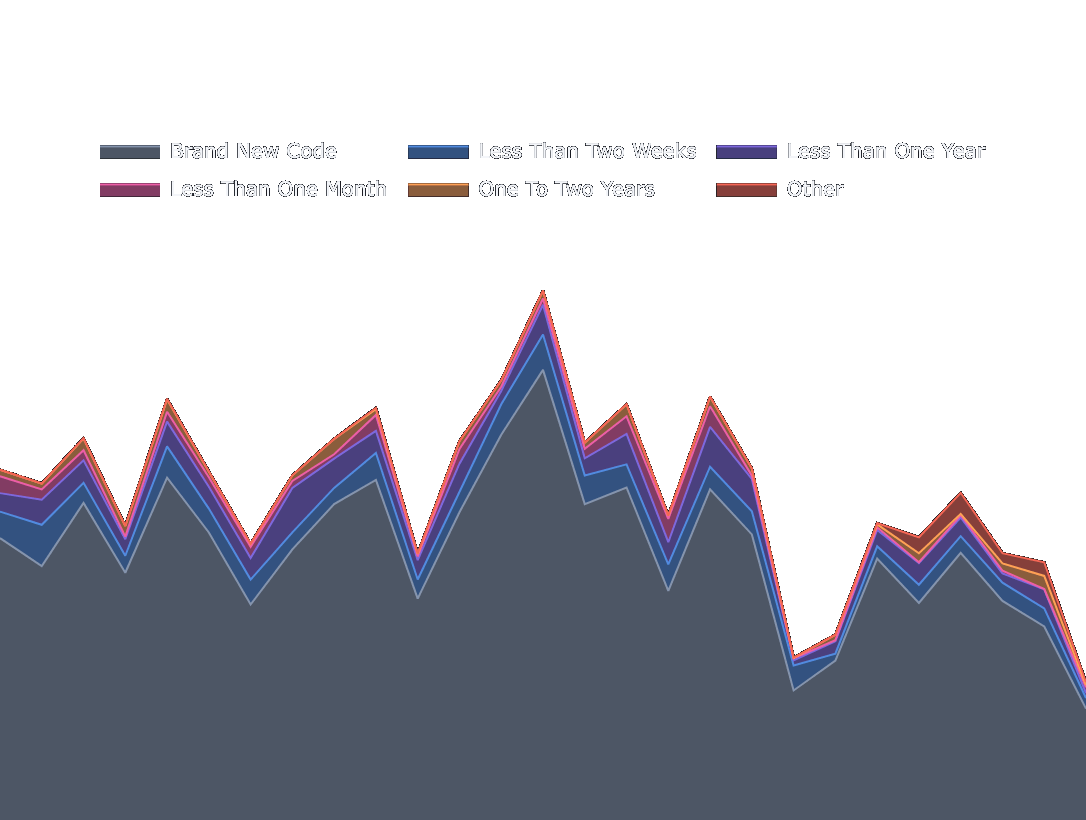
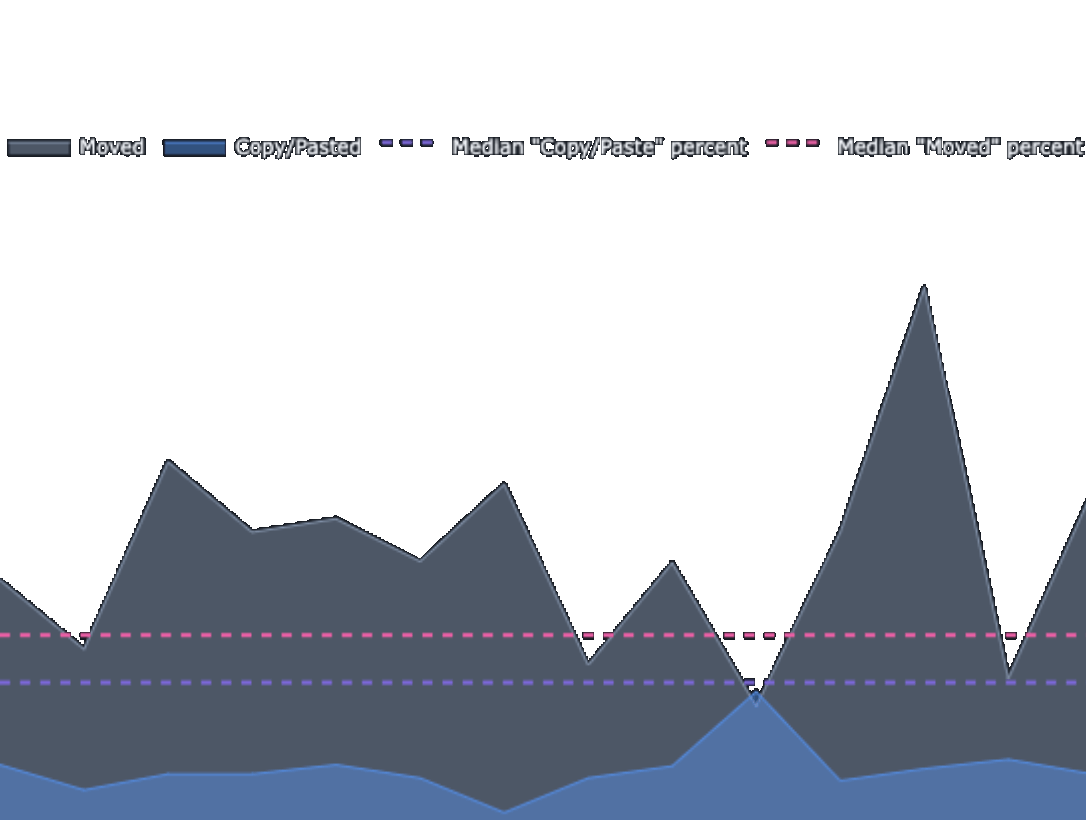
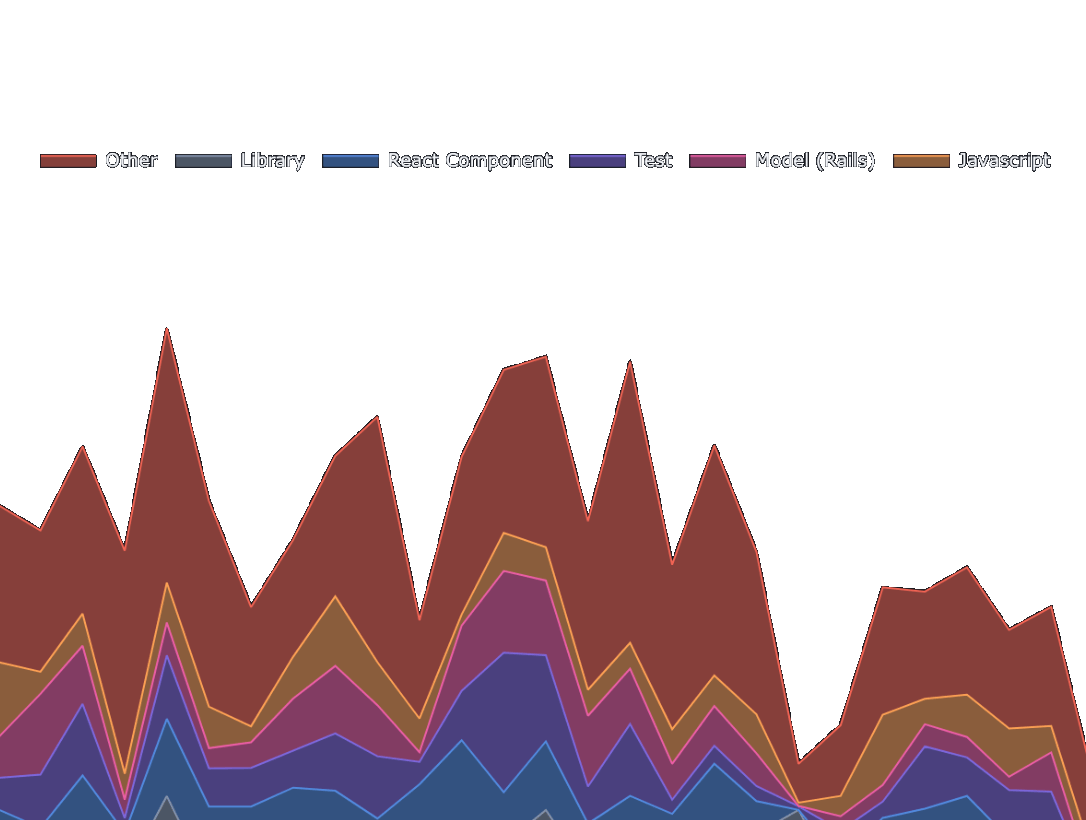
Area Graph
An area graph of some range (as little as a week, as much as 15 years) of a dev team's work.
Area segments can graph Diff Delta (a proxy for "energy required"), colored by any number of available segments:
- Git repo path
- Issue/Jira ticket being worked
- Type of work (bug fix, feature work, chore, tech debt, etc)
- Code operation (add, delete, moved, replaced, copy/paste)
Recent work underway is an optional section to list Jira tickets that you/team have been working on. You configure the date range, tickets published, and repos eligible.


Trusted by health care providers, banks, and thousands of companies across industries